Graph of a Function
Definition
Let be a subset of and let be a function. The graph of is
which is a subset of the Cartesian product
Interpretation
The graph turns a function into a picture. It collects the pairs as points of the coordinate plane , so that the behaviour of can be read off by eye: the Cartesian coordinate system places each input on the horizontal axis and its output on the vertical axis.
The graph is a set of points with exactly one point above each in the domain . So every vertical line meets the graph once when and not at all when . This vertical line test decides which curves in the plane are graphs of functions of : the unit circle is not one, since the line meets it at and at .
Horizontal lines describe outputs: the line meets the graph exactly above the inputs with . In particular, the zeros of are where the graph meets the -axis, the range of is the projection of the graph onto the -axis, and is injective if and only if no horizontal line meets the graph more than once. Likewise, the graph of an increasing monotone function never falls from left to right.
A plot is a guide, not a proof. It shows finitely many sampled points, so a single missing point or very fast oscillation can be invisible, and a claim read off a picture still has to be checked from the formula. The idea returns later for functions of two variables, whose graphs are surfaces in space.
Key Results
- Each input corresponds to exactly one point on the graph.
- The graph encodes continuity and monotonicity visually.
- Many analytical properties can be inferred from the graph.
Examples
- The graph of is a parabola.
- The graph of grows rapidly.
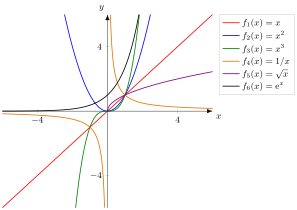
The graph of is the set of points ; the graph of has two branches, as is not in its domain.
Prerequisites
Related Concepts
Sources
- Math I: Calculus · Lecture 4
Aliases: function graph Symbols: element of, real numbers, subset
Last updated: 27 October 2026 11:52
Graph of a FunctionHorizontal AsymptoteInflection PointStationary PointVertical AsymptoteFunctionCartesian Coordinate SystemConvexity and ConcavityDomainZero of a Function