Newsvendor Price Sensitivity
Proposition
For a fixed integer quantity and fixed purchase cost and salvage value , newsvendor price sensitivity finds selling prices for which remains optimal. The condition is
The endpoints include ties with neighbouring quantities.
Interpretation
The question is how far the selling price can move before a chosen order stops being optimal. The price enters the newsvendor model only through the critical ratio , so the question becomes: for which prices does stay between the two CDF values that make optimal?
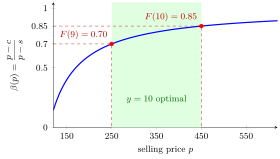
With and , the curve rises with . It reaches at and at , so is optimal for every price in the shaded interval . Below the target probability drops under and fewer units are optimal; above it exceeds and more units are optimal.
Fix the quantity and vary the price : stays optimal while .
The two inequalities come from the discrete newsvendor rule. The condition says that adding unit does not lower the expected cost, and says that removing unit does not lower it. At an endpoint one of them holds with equality and a neighbouring quantity is equally good. Since increases with , the set of prices is an interval, and solving gives each endpoint:
So the optimal quantity, as a function of the price, is constant on intervals and jumps at their endpoints. This is the newsvendor version of sensitivity analysis for linear programs, where a coefficient may move within a range without changing the optimal solution.
Key Results
- The condition is for being an optimum, not necessarily the smallest optimum.
- At the lower boundary, can tie with .
- This analysis holds the demand distribution fixed, as the exercise does.
Examples
At , quantities 9 and 10 tie; at , quantities 10 and 11 tie. Increasing price past the upper endpoint calls for additional stock, with demand distribution held fixed.
- The dress solution uses effective unit cost and salvage .
- For , and give .
Prerequisites
Related Concepts
Sources
- OR Modelling · Week 6
Symbols: beta
Last updated: 20 October 2026 03:02
Newsvendor Price SensitivityDiscrete Newsvendor RuleCritical RatioSensitivity Analysis