Graphical Method
Definition
The graphical method solves a two-variable LP by drawing each constraint boundary, identifying the common feasible region, drawing a constant-objective line, and moving that line in the direction of improvement until the best feasible contact is reached. Intersecting the relevant boundary equations gives exact coordinates.
Interpretation
The method makes feasibility and optimality visible. It also reveals whether the best value is attained at one point or along a segment.
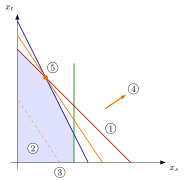
The numbered markers illustrate the method for the objective :
- Draw the boundaries , and .
- Shade their common feasible region, including the restrictions .
- Draw a constant-objective line, such as the dashed line .
- Move the line in the improving direction while it still touches the feasible region.
- The last contact is the optimum, here the corner .
Push the objective line in the direction of the arrow until it last touches the feasible region; press the button to jump there. Here the last contact is the corner .
Key Results
- Determine the allowed side of each boundary from the inequality; do not assume it is always below the line.
- Check the direction of improvement from the objective, especially with negative coefficients.
- Also allow for an empty feasible region or an objective that can improve without bound.
Examples
- Maximizing with , , gives .
- For , increasing moves its objective line downward.
Prerequisites
Related Concepts
Sources
- OR Modelling · Week 1
Aliases: graphical solution method, graphical solution procedure
Last updated: 20 October 2026 03:02
Graphical MethodDiet ProblemGraphical Integer ProgrammingLinear ProgrammingFeasible RegionObjective LineCorner PointMultiple Optimal Solutions