Normal Demand Distribution
Definition
In the course's normal demand approximation, with standard deviation . If is the standard normal CDF, then
Interpretation
Normal demand is described by two numbers: the mean , the typical demand level, and the standard deviation , the typical size of deviations from it. The optimal order starts from and adds a safety amount , which depends on the costs only through the critical ratio.
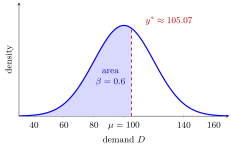
The bell curve is the demand density, centred at with ; areas under it are probabilities. The shaded area to the left of equals . Since , the order lies about a quarter of a standard deviation above the mean: .
Standardizing turns the continuous newsvendor rule into , a single look-up in the standard normal table, and the quantile is then rescaled. If , the order lies above the mean; if , below it; and gives . More uncertainty, a larger , moves the order further from the mean in the same direction.
A common slip is to use the variance instead of : with the meal example would give an order of about instead of . The normal model also gives some probability to negative demand; this hardly matters when is several standard deviations above , and if the formula gives a negative quantity the order is .
Key Results
- Use the standard deviation , not the variance , in the quantile formula.
- The order quantity must satisfy . Use the normal quantile when it is nonnegative; otherwise the constrained optimum is .
- The untruncated normal distribution allows negative values; the course examples retain that approximation.
- The normal table gives rounded quantiles.
Examples
The shaded area in the figure is . Table values and bracket the standardized quantile between 0.25 and 0.26.
- Meal demand with , and gives about 105.07.
- For apples, and the source table approximation gives 82.75 kilograms.
Prerequisites
- Continuous Newsvendor Rule
- Normal distribution
Related Concepts
Sources
- OR Modelling · Week 6
Aliases: normal demand approximation Symbols: beta, mu, phi, sigma
Last updated: 20 October 2026 03:02
Normal Demand DistributionContinuous Newsvendor RuleStandard Normal DistributionUniform Demand DistributionWeibull Demand Distribution