Simplex Tableau
Definition
A simplex tableau records the variable coefficients, right-hand sides, and basic-variable labels of the current simplex equations. In the course convention, the first row writes the objective as
In canonical form (also called proper form), basic-variable columns form unit columns and have zero objective-row coefficients.
Interpretation
A simplex tableau is the bookkeeping of the simplex method: it writes the current equations as a table of coefficients, one row per equation, with the objective as an extra equation on top. The table makes the row operations of a pivot, and reading off the current solution, mechanical.
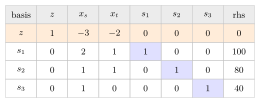
This is the starting tableau of the Giapetto model. The orange row is the objective , with all variable terms on the left. The highlighted entries show that the columns of , and are unit columns, each with its in a different row, so these slacks are the basic variables named in the first column.
A canonical tableau is read in two directions. For a variable named in the basic-variable column, its unit column identifies its row, and that row's right-hand side is its value when the nonbasic variables are zero. A nonbasic column can also happen to be a unit column, so the column shape alone does not identify the chosen basis. Along the objective row, the right-hand side is the current value , and the entry under a nonbasic variable means that changes by per unit increase of , which is what the optimality test reads.
The signs cause most slips. The row means , so the negative entries mark profitable directions, not losses. Writing the objective as shows the same information with opposite signs.
Key Results
- Set nonbasic variables to zero and read basic values from the solution column.
- The objective-row right-hand side is the current objective value.
- A negative nonbasic coefficient indicates an improving direction for maximization.
Examples
The illustrated system is , , , with objective . The orange objective row places coefficients on the left, and the blue basic columns form an identity matrix. Setting gives , , , .
- gives initial objective coefficients .
- The final main-example row is .
Prerequisites
Related Concepts
Sources
- OR Modelling · Week 2
Aliases: simplex table Keywords: tableau Symbols: sum
Last updated: 27 October 2026 11:52
Simplex TableauEntering Variable RuleReduced CostShadow Price in Linear ProgrammingSimplex Optimality TestSimplex PivotTwo-Phase MethodBasic VariableNonbasic Variable