Project Selection Model
Definition
The project selection model chooses complete projects under resource budgets. Let if project is selected, be its return, its expenditure in year , and that year's budget. Then
Interpretation
The model chooses which complete projects to fund so that the total return is as large as possible without exceeding any year's budget. A project uses resources in each relevant year and contributes its full return only when selected; fractional project funding is excluded.
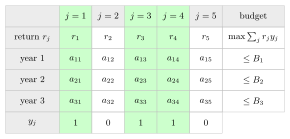
The green columns are the selected projects 1, 3 and 4, with . Each year's budget row adds only their expenditures, , because the unselected projects 2 and 5 have and contribute nothing.
The product equals when project is selected and 0 otherwise, so is the spending on the selected projects in year . The same appears in every year's constraint: a selected project must be paid for in every year it needs money, and the projects compete for the budget of each year. The model is a binary integer program with one binary variable per project.
Ranking projects by return, or by return per unit of cost, and funding them in that order is a heuristic that can miss the optimum. With a single budget of 10, a project costing 6 with return 7 has the best ratio, but after funding it neither of two projects costing 5 with return 5 fits; funding those two instead gives return 10.
Key Results
- A separate budget constraint is needed for each year.
- The later development-project example uses one capital budget.
- Relaxing a binary variable to a fraction supplies a bound but not an implementable partial project.
Examples
The green columns in the figure represent selected projects, ; each budget row sums only their expenditures.
- The week 2 exercise has five projects and a budget of 25 in each of three years.
- The development-project example has capital 20 and an optimal return of 3.4 from projects 1, 3, and 4.
Prerequisites
Related Concepts
Sources
- OR Modelling · Week 2
Aliases: project selection problem Symbols: element of, sum
Last updated: 20 October 2026 03:02
Project Selection ModelBinary Integer ProgramBranch-and-BoundContingent Decisions