Normal Distribution
Definition
Let and . A continuous random variable has a normal distribution with mean and variance , written , if its density is
Interpretation
A normal distribution is the familiar bell-shaped distribution. It is widely used because many sums and averages of independent variables behave approximately normally, by the central limit theorem.
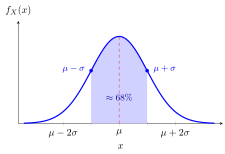
The curve is symmetric about its mean , and its variance is . Approximately of its probability lies within , and lies within .
Move to shift the bell and to widen it. The interval always holds about of the probability.
As a continuous random variable, the normal variable assigns probabilities by areas under the density. The exponential function applied to the negative squared standardized deviation gives its bell-shaped decay.
Key Results
- A normal distribution is determined by its mean and variance.
- Standardizing a normal random variable gives a standard normal random variable.
- Sums of independent normal random variables are normal.
Examples
- Measurement error is often approximated by a normal distribution.
- The average of many small independent effects is often modelled as normal.
- Manufacturing deviations from a target dimension are frequently modelled with a normal distribution.
Prerequisites
Related Concepts
- Standardization
- Quadratic Form
- Binomial Distribution
- Rayleigh Distribution
- Sum of Independent Random Variables
- Symmetric Distribution
Sources
- Probability Theory for EOR · Week 5
Aliases: Gaussian distribution, normal random variable, Gaussian random variable, normally distributed Keywords: bell curve, N(mu, sigma^2) Symbols: element of, mu, pi, real numbers, sigma, square root
Last updated: 20 October 2026 03:02
Normal DistributionFolded Normal DistributionLognormal DistributionStandard Normal DistributionContinuous Random VariableProbability Density FunctionExponential FunctionStandardizationQuadratic FormBinomial DistributionRayleigh DistributionSum of Independent Random VariablesSymmetric Distribution