Summary Measures of a Distribution
Definition
Let be a random variable with a distribution. Summary measures of a distribution are numerical quantities, such as centre, spread, and shape measures, that describe important features of that distribution.
Interpretation
Summary measures condense a distribution into a few numbers that answer simple questions: where is it centred, how spread out is it, and what is its shape? They allow distributions to be compared without listing every probability.
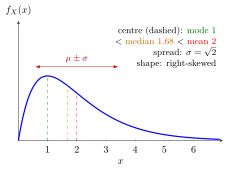
The figure annotates the density for . Three measures of centre are marked: the mode at the peak, the median that halves the area, and the mean . The arrow shows one standard deviation on each side of the mean, from about to . The density is right-skewed, with a long right tail, and mode, median and mean appear in that order from left to right.
Measures of location answer different questions and can disagree, as here. The mean is the balance point and reacts to extreme values; the median depends only on the order of the values; the mode marks where values are most concentrated. Spread measures, such as the standard deviation or the distance between the quartiles, measure how far values typically lie from the centre. Shape measures describe symmetry and the number of peaks, the modality.
A summary always loses information. and both have mean and variance , yet one is flat on a bounded interval and the other is a bell curve on the whole line. Numerical measures of shape, skewness and kurtosis, follow later.
Key Results
- Location measures describe centre.
- Spread measures describe variability.
- Shape measures describe asymmetry, tail weight, or modality.
Examples
- Mean and median summarize the centre of delivery times.
- Variance and standard deviation summarize variability in demand.
- Skewness and kurtosis summarize shape features of a loss distribution.
Prerequisites
Related Concepts
Sources
- Probability Theory for EOR · Week 6
Keywords: distribution summaries, numerical summaries Symbols: sigma, square root
Last updated: 20 October 2026 03:02
Summary Measures of a DistributionDistributionMedianModeExpectationQuantile Function