Central Limit Theorem
Theorem
Let be i.i.d. with mean and finite positive variance . Then the sample mean satisfies
Equivalently, for the sum ,
Here denotes a normal distribution with mean and variance , and is the standard normal CDF.
The i.i.d. assumption supplies the common distribution and independence used by the theorem. The arrow denotes Convergence in Distribution: the CDF of the standardized average tends to the standard normal CDF at each real threshold.
Interpretation
The properly centred and scaled fluctuations of an i.i.d. sum approach a standard normal distribution, whatever the distribution of the individual terms, provided their variance is finite and positive. This gives approximate probabilities for sums and averages that would be hard to compute exactly.
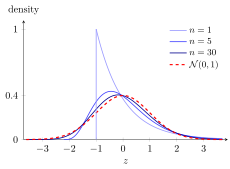
The figure shows the density of for i.i.d. observations, so , together with the standard normal density. For , is an exponential density shifted to start at , strongly skewed. For it is already a hump, and by it is close to the normal curve, with a slight remaining skew to the right. Since has a gamma distribution, these curves are rescaled gamma densities.
The scaling is essential. By the law of large numbers, itself shrinks to ; dividing by the standard deviation of is standardization, which keeps the variance at for every and makes the shape visible. The conclusion is convergence in distribution: the theorem gives probabilities , not a statement about the values of .
For Bernoulli terms the theorem becomes the normal approximation to the binomial, and for integer-valued sums the continuity correction improves it. A common misreading is that the observations themselves become normal for large . They keep their own distribution; only the standardized sum or average is approximately normal.
Key Results
- For large , is approximately and approximately .
- The finite-sample approximation is not an exact normality claim; i.i.d. normal observations are a special case where the standardized sum is exactly normal.
Examples
- For i.i.d. observations, .
- For independent fair die rolls, the sum has mean and standard deviation ; is approximately with continuity correction.
Prerequisites
- Independent and Identically Distributed Random Variables
- Sample Mean
- Variance and Standard Deviation
- Convergence in Distribution
- Standard Normal Distribution
Related Concepts
Sources
- Nicky van Foreest · Probability Distributions · Week 8
Aliases: CLT Symbols: infinity, mu, phi, sigma, square root, sum
Last updated: 20 October 2026 03:02
Central Limit TheoremNormal Approximation to the BinomialIndependent and Identically Distributed Random VariablesSample MeanVariance and Standard DeviationConvergence in DistributionStandard Normal DistributionWeak Law of Large NumbersStrong Law of Large NumbersContinuity Correction