Normal Approximation to the Binomial
Approximation
For with fixed , as ,
For a finite the normal approximation can be inaccurate when or is small; there is no universal finite- accuracy guarantee.
A Binomial Distribution count is a sum of i.i.d. Bernoulli indicators. The Central Limit Theorem applied to that sum gives the stated normal limit after centring and scaling.
Interpretation
A binomial count with many trials is approximately normal with the same mean and variance . The reason is that is the distribution of a sum of i.i.d. Bernoulli indicators, so the central limit theorem applies to it.
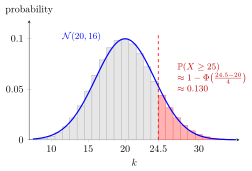
The figure compares with : mean , variance , standard deviation . The highlighted tail has exact probability . With the continuity correction, the normal tail from gives , while starting at would give .
Change and : once is large the bars follow the normal density with mean and variance .
The limit statement keeps fixed while grows. For a finite , the approximation is poor when or is small: the binomial is then skewed and piled up near or , while the normal curve is symmetric and puts probability below or above . Standardizing the count gives the displayed form; dividing it by instead gives the proportion of successes , a sample mean of indicators, which is approximately .
A common slip is to use as the variance, or to forget the square root in the standard deviation . In the figure the standard deviation is , not or .
Key Results
- For fixed , has and .
- For a finite- threshold , a continuity-corrected approximation is .
Examples
- For , .
- For , .
Prerequisites
Related Concepts
Sources
- Nicky van Foreest · Probability Distributions · Week 8
Aliases: de Moivre-Laplace theorem Symbols: element of, infinity, phi, square root
Last updated: 20 October 2026 03:02
Normal Approximation to the BinomialBinomial DistributionCentral Limit TheoremContinuity CorrectionStandard Normal Distribution