Life Table
Definition
A life table specifies survivor numbers at ages for a hypothetical cohort with a chosen initial size, the radix. Annual deaths are . Within the mortality model represented by the table, for ,
Fractional ages require an interpolation assumption if only integer-age entries are supplied.
Interpretation
The table expresses a survival model through cohort counts. Its numbers may be modelled or estimated; the displayed ratios do not remove sampling or projection uncertainty.
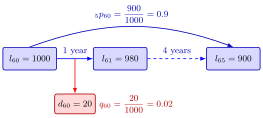
The figure follows the cohort in the Examples. Of lives, die before age 61, so ; after five years remain, so . Every probability is a ratio of table entries, which is why rescaling the radix leaves it unchanged.
Key Results
- .
- Scaling all entries by the same positive constant leaves survival probabilities unchanged.
- A population table and an insured-life table can differ through selection. Choose the table appropriate to the covered population.
- Use table ratios only when a table is given or a corresponding table model has been specified.
Examples
For and , . If , then .
Prerequisites
Related Concepts
Sources
- Life Insurance · Lecture 2
Aliases: mortality table, survivorship table, cohort life table, actuarial table Keywords: radix, l x survivors, d x = l x - l x+1, q x = d x / l x, t p x = l x+t / l x
Last updated: 17 October 2026 21:53
Life TableConstant Force Within a Year of AgeSelect and Ultimate MortalityUniform Distribution of DeathsActuarial Survival and Death ProbabilitiesMakeham's Mortality Law